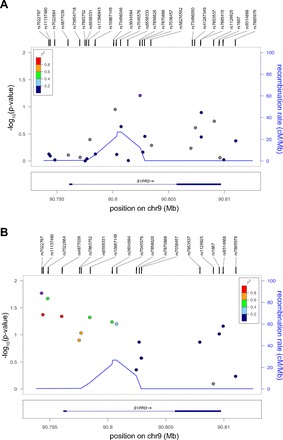
Fig. 1.

Regional plots of S1PR3 gene association with acute respiratory distress syndrome (ARDS) by chromosome position in African-descent individuals from Chicago (A) and European descent from Chicago (B). P values are expressed in −log10 scale. Associations are color coded to reflect the underlying linkage disequilibrium of the single nucleotide polymorphism (SNP) tested with respect to the top associated SNP on each case (depicted in purple) based on pairwise r2 values from data deposited in the 1000 Genomes Project for European populations. Estimated recombination rates are also plotted on the right axis to reflect the local linkage disequilibrium structure. cM/Mb, centimorgans per megabase.
