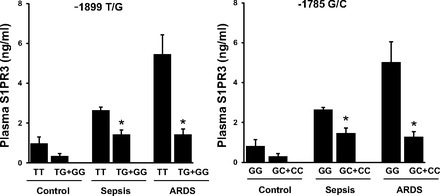
Fig. 5.

Breakdown of S1PR3 plasma levels by S1PR3 genotypes in each of 3 sample groups (control, sepsis, and ARDS). Alleles −1899T and −1785G are associated with trends of higher S1PR3 levels in controls and significant higher S1PR3 levels in sepsis and ARDS groups (*P < 0.05), compared with the alleles −1899G and −1785C, respectively.
