
Fig. 2.
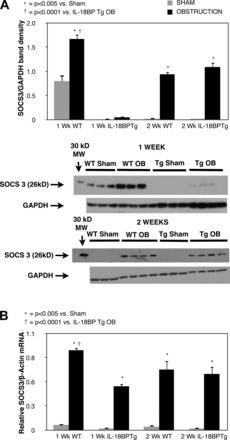
Renal cortical SOCS3 protein expression and quantitative SOCS3 mRNA expression following UUO. A: gel photograph and densitometric analysis of SOCS3 expression represented as a percentage of GAPDH in WT and IL-18BP Tg animals exposed to sham operation (Sham) or 1 or 2 wk of UUO (OB). B: quantitative SOCS3 mRNA expression represented as a percentage of β-actin in WT and IL-18BP Tg animals exposed to sham operation or 1 or 2 wk of UUO.