
Fig. 4.
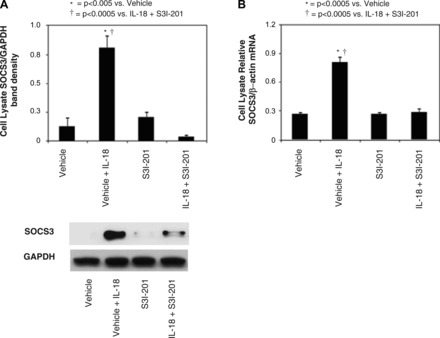
HK-2 cell SOCS3 protein expression and quantitative SOCS3 mRNA expression following IL-18 stimulation in vitro. A: gel photograph and densitometric analysis of SOCS3 protein expression represented as a percentage of GAPDH in HK-2 cells following 2 days of cell stimulation with recombinant human IL-18 (100 ng/ml) in in the presence or absence of STAT3 inhibition (50 μM S3I-201). B: quantitative SOCS3 mRNA expression represented as a percentage of β-actin in HK-2 cells following 2 days of cell stimulation with recombinant human IL-18 (100 ng/ml) in the presence or absence of STAT3 inhibition (50 μM S3I-201).