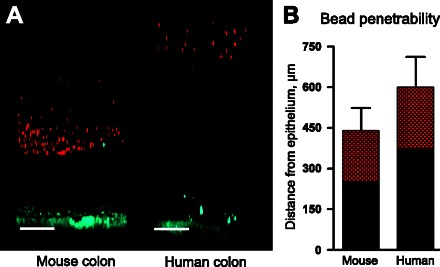
Fig. 5.

Mucus penetrability to 1 μm far red fluorescent beads in mouse and human colon. A: representative Z-stack projections from mouse and human colon with the tissue in blue and beads in red. Scale bar 100 μm. B: distribution of bead intensity in mouse (n = 6) and human (n = 8) colonic mucus. The red area represents the part of the mucus that is penetrated by the beads, whereas the black part represents the part of the mucus that is not penetrated by the beads. Data are presented as means ± SD.
