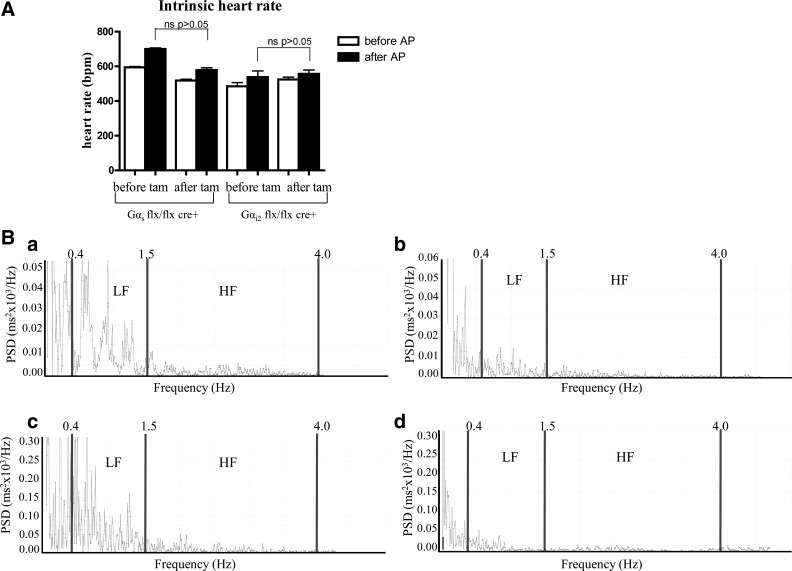
Fig. 4.
Autonomic blockade. A: intrinsic heart rate after autonomic blockade with atropine and propranolol in Gαsfl\flx cre+ and Gαi2flx\flx, cre+ mice (n = 6 in both groups). Values are expressed as means ± SE. B: representative power spectrum density (PSD) traces for Gαsflx\flx cre+ (a and b) and for Gαi2flx\flx, cre+ (c and d) after prior treatment with tamoxifen and shown are the PSDs before (left, a and c) and after (right, b and d) atropine and propranolol administration.

