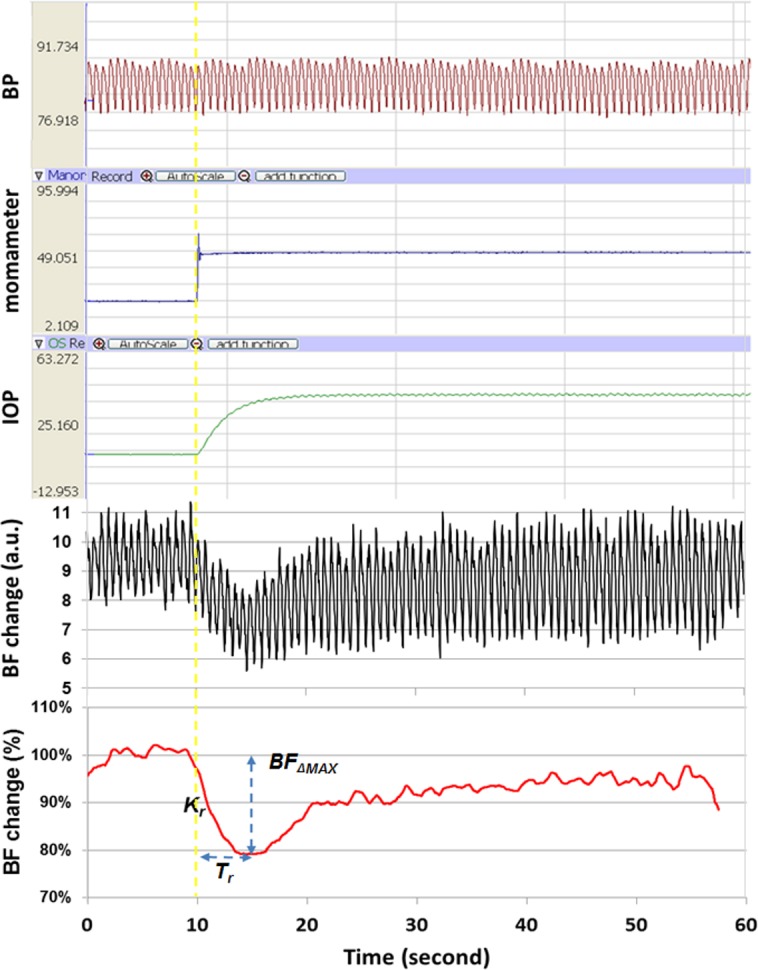
Figure 1.

An example of IOP step increase-induced dAR response and parameter analysis. The top trace shows BP recorded 10 seconds before and during the IOP elevation. On the 10th second (vertical yellow dotted line), the manometer pressure (second trace) was rapidly increased from 10 to 40 mm Hg, resulting in a corresponding IOP increase (third trace). The fourth trace shows the LSFG recording of ONH BF response, a rapid BF decrease, and a gradual recovery toward the previous level, which took up to 3 minutes for a full recovery.27 The bottom curve is the average from triplicate recordings of the fourth trace and smoothed (bottom) to remove pulsatile effects of the cardiac cycle. Four parameters were extracted to characterize the BF response curve (see text for details).
