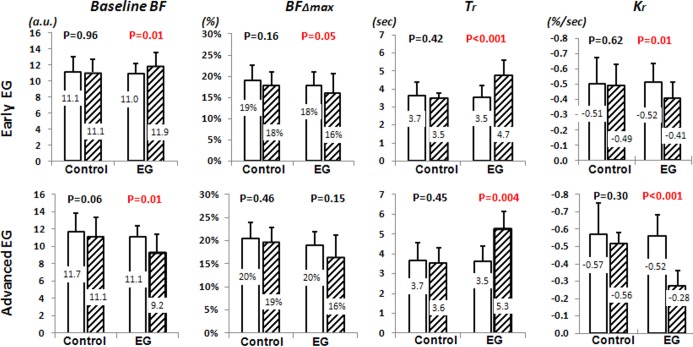
Figure 3.
Comparison of dAR parameters between the prelaser stage (unfilled bars) and during the postlaser follow-up phase (hatched bars) in control eyes and EG eyes during early-stage EG (n = 15, top row) and moderate to advanced EG (n = 9, bottom row). Each column shows the result for one of the dAR parameters. The mean value shown by each bar is also listed on the bar; error bars represent SD. P values listed above each pair of bars are the result of comparing the average parameter value for a given postlaser stage against the average prelaser baseline for each individual eye across the group (two-tailed paired t-test).

