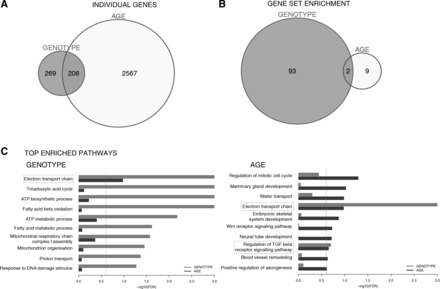
Fig. 2.

mRNA expression and gene set enrichment analysis in MKO vs. aging muscle. A and B: unique and overlapping transcript no. (A) and enriched gene sets (B) identified by multivariant analysis of expression arrays (n = 3; P < 0.05, FDR = 25%) of gastrocnemius muscle RNA from WT vs. MKO (genotype) or 10-wk-old vs. 24-mo-old (age) mice. C: the top 10 significantly enriched gene sets [ranked by false discovery rate (FDR)] for genotype or age. Gray (genotype) or black (age) bars represent relative strengths of gene set enrichment (FDR, x-axis). Gray dashed line represents cutoff of significance (FDR = 25%), and light gray boxes denote pathways shared across genotype and age data.
