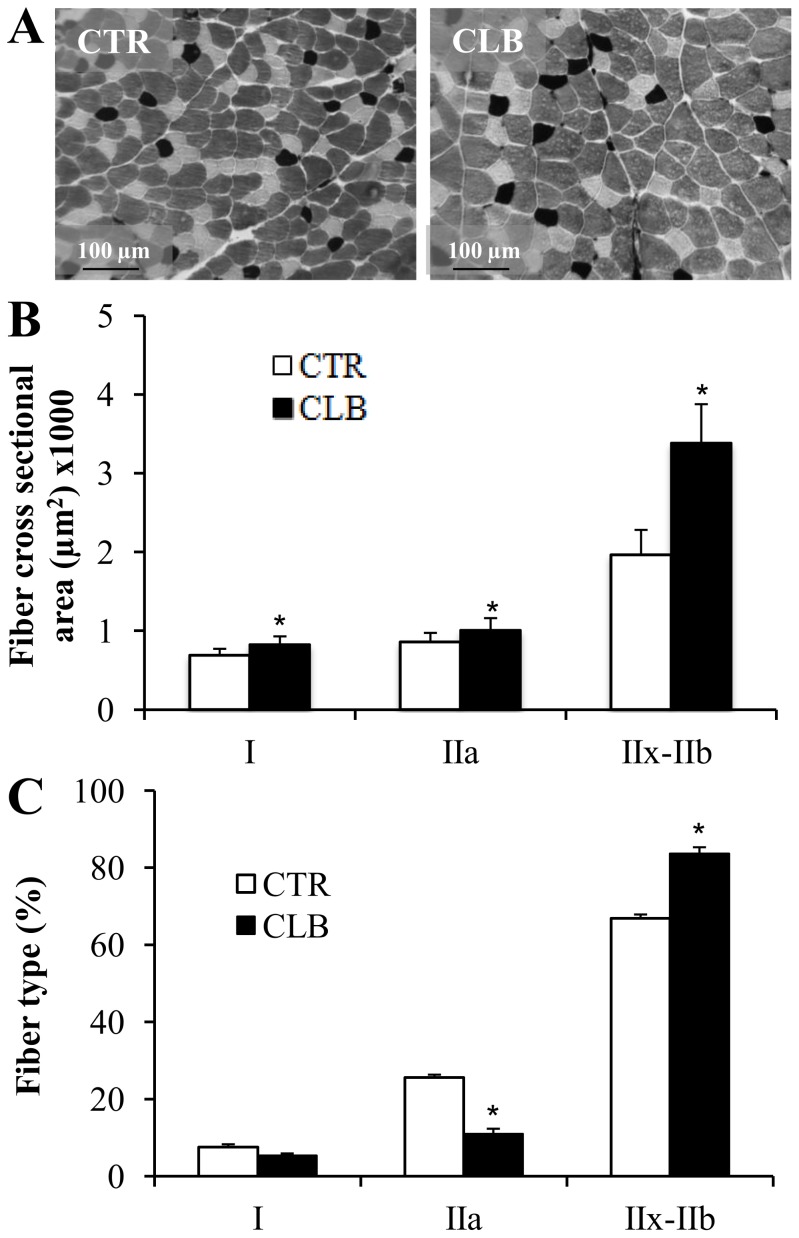
Figure 1. Effects of chronic clenbuterol treatment on EDL fiber-type profile and muscle-fiber cross-sectional area.
A, Histochemical staining for Myosin ATPase in 6 µm EDL cryosections from control (CTR; untreated group) and clenbuterol-treated (CLB) animals. The images correspond to staining for ATPase activity. The dark stain highlights fibers that mainly express Myosin Heavy Chain-I (MyHC-I); the light stain indicates fibers that mainly express MyHC-IIa; and the intermediate color corresponds to fibers that mainly express MyHC-IIx-IIb. B, Quantification of Myosin ATPase staining revealed an increased cross-sectional area for all fiber types following clenbuterol treatment (In µm2, type I from 689.52±29.56 to 828.53±35.96, type IIa from 860.84±40.37 to 1009.43±54.18, type IIx-b from 1968.74±111.39 to 3390.55±173.64). * p<0.05 compared to CTR. C, Treatment with clenbuterol induced a phenotypic shift from slow-oxidative to fast-glycolytic profile (type I from xxx ± xx to xxx ± xx, type IIa from xxx ± xx to xxx ± xx, type IIx-b from xx ± xx to xxx ± xx). Values are expressed as the mean ± SEM (7 animals in each group). * p<0.05 compared to CTR.

