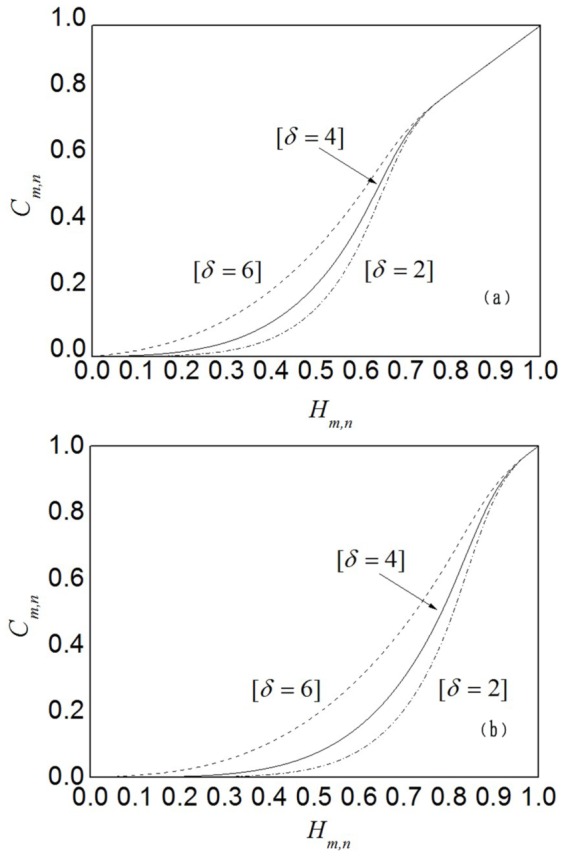
Figure 1. Customer satisfaction function Cm,n.

(a) and (b) depict the distributions of customer satisfaction as recorded at the fixed expectation H exp = 0.7 and H exp = 0.9, where the parameter δ is varied from 2 to 6 in increment of 2. It can be observed that the rate of change in customer satisfaction differs significantly when Hm,n falls below and exceeds the expectation.
