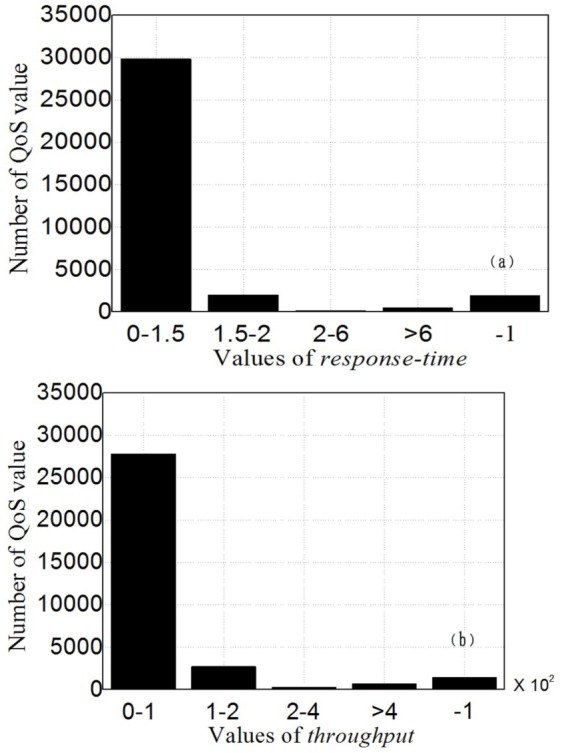
Figure 2. QoS value distributions.

(a) and (b) depict the value distributions of response-time and throughput in our customer-service matrices, where “−1” indicates that the service invocation failed due to an http error. The ranges of response-time and throughput are 0–16.053 seconds and 0–541.546 kbps, respectively.
