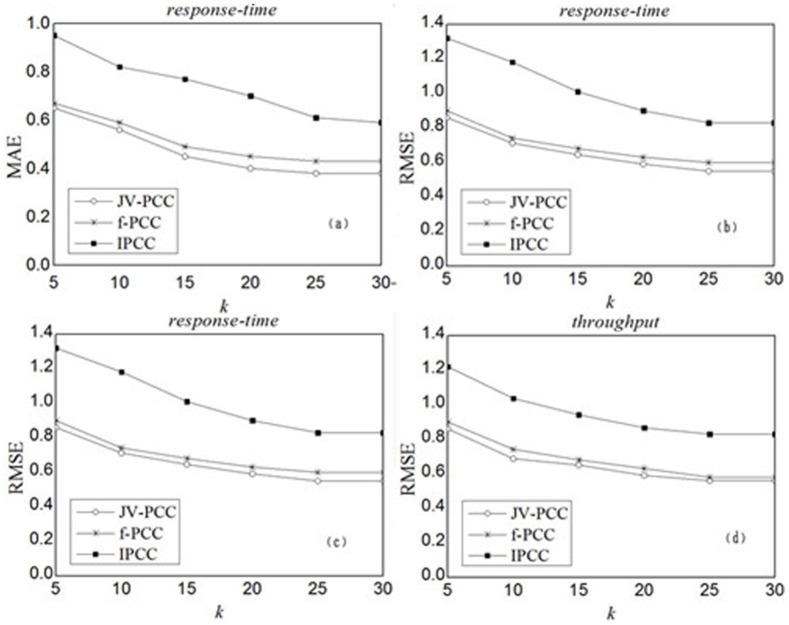
Figure 5. Impact of neighborhood size k.
(a) and (b) depict the MAE fractions of JV-PCC, f-PCC and IPCC for response-time and throughput, while (c) and (d) depict the RMSE fractions. It can be observed that JV-PCC achieves smaller MAE and RMSE consistently than f-PCC for both response-time and throughput. Regardless of JV-PCC or f-PCC, as k increases, MAE and RMSE drop at first, indicating that better performance can be achieved by employing more similar services' records to generate the predictions. However, when k surpasses a specific level (i.e. k = 25), they fail to drop with a further increase in k, which were caused by the limited number of similar neighbors.

