
Figure 1. Genotypic relatedness of 1020 MRSA isolates represented as a minimum spanning tree based on MLVA types.
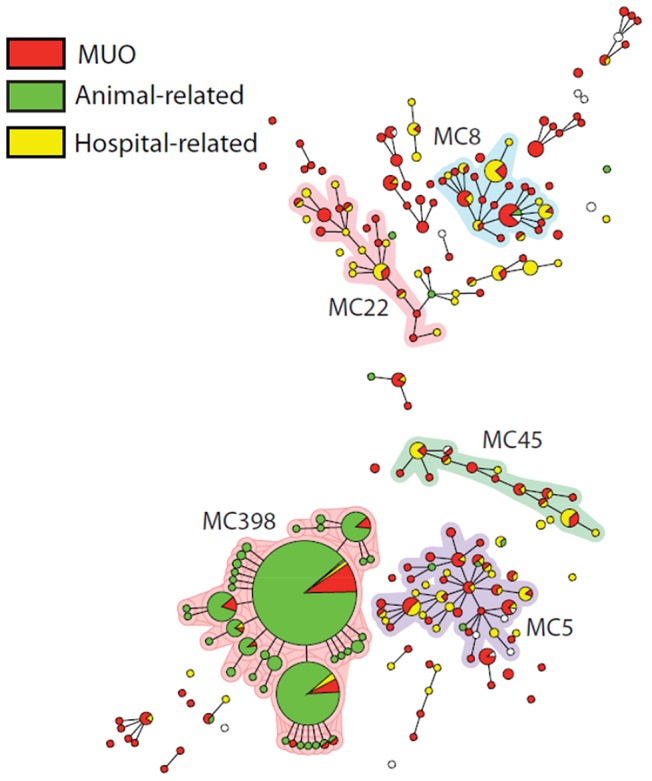
Clustering of MLVA profiles was obtained using a categorical coefficient to create a minimum spanning tree in which the MLVA types are displayed as circles. The size of each circle indicates the number of isolates with this particular type. MLVA complexes (MC) are indicated in characters e.g. MC398 denotes MLVA complex 398.