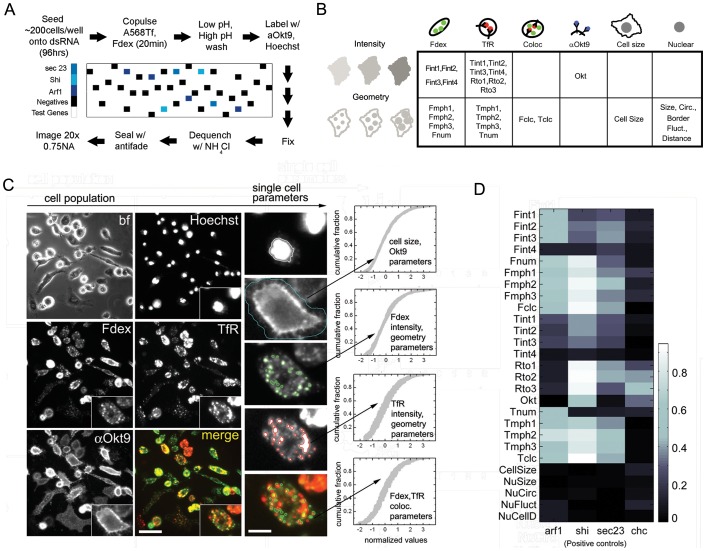
Figure 1. Quantitative profiling of two endocytic routes at single cell resolution.
(A) Experimental workflow outline for cell seeding, transfection and multiplex endocytic assays to obtain multifeature data across 7131 gene depletions. The entire procedure was performed on a cell array (see Figure S1A; details in SOM) and the positions of negative and positive (dsRNA against sec23, arf1, shi) controls are highlighted in their respective colours. (B) Table grouping the 27 quantitative features into categories. The top half of the table contains direct measurements of intensity, while the lower half contains geometric parameters of the cell, endosomes and nucleus. Various measurements are made from each fluorescent channel, including those utilizing different pixel radii for local background subtraction while detecting endosomes. (C) Representative brightfield (bf) and fluorescent micrographs of a field of view of individual cells (zoomed in insets) labeled with four different fluorescent probes: Hoechst; FITC-Dextran (Fdex); Alexa568-Tf (Tf); Alexa647-αOkt9 (Okt9); (see Methods S1 for details). The psuedocolour merge image is a composite of the Fdex (green), TfR (red) and Okt9 (blue) channels. Scale bar = 15 µm; inset = 3×. (D) Grayscale heatmap representing the fraction of four control genes (arf1 (arf79f); shi; sec23; chc) picked up as hits (above a Z-score threshold of 3) across all 27 features in the entire dataset. Higher values on the grayscale bar denote higher pick-up rates. The features with higher pick-up rates correspond to the known endocytic roles of these genes.

