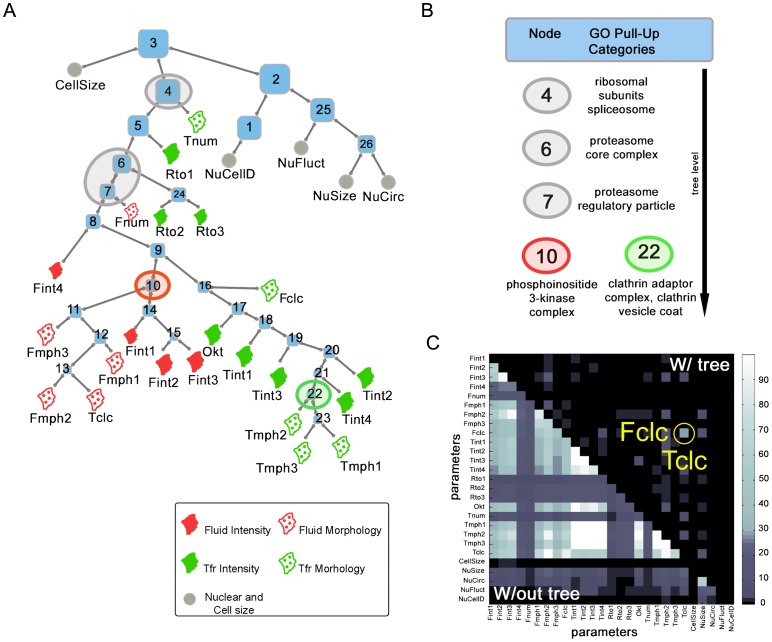
Figure 2. A hierarchical organization of endocytic hits.
(A) Maximum parsimony dendogram constructed by binarizing and clustering the perturbation vectors (PV) which show which features each gene is known to perturb. The root node (node 3) is the shared bifurcation point above three main branches – these correspond to genes affecting endocytic pathways, cell size and nuclear morphology PV features. Housekeeping genes such as RNA polymerase and proteasomal subunits populate the stem of the endocytic branch (nodes 4–7) – these affect endocytic processes as a whole. The lower endocytic nodes are further split into CG and CD specific nodes at node 9. (B) Gene Ontology (GO) annotation terms were overlaid onto the tree structure, and GO terms that were present in more than one node were allowed to rise if these nodes were connected. The highest node at which a GO term was found at is shown as a GO ‘Pull-up’ category. For instance, highest node at which the clathrin adaptor complex and clathrin vesicle coat GO terms rise to is node 22, which is the central node specific for CD endocytosis. (C) Grayscale heatmap representing extent of overlaps between all pairs of leaves (colorbar depicts the fraction of overlapping genes) of the leaves prior to (lower diagonal), and post (upper diagonal) tree construction. Most genes which overlapped prior to tree construction have risen to internal nodes. Post the tree construction, significant overlap is seen only between Fclc and Tclc nodes (circled in yellow).

