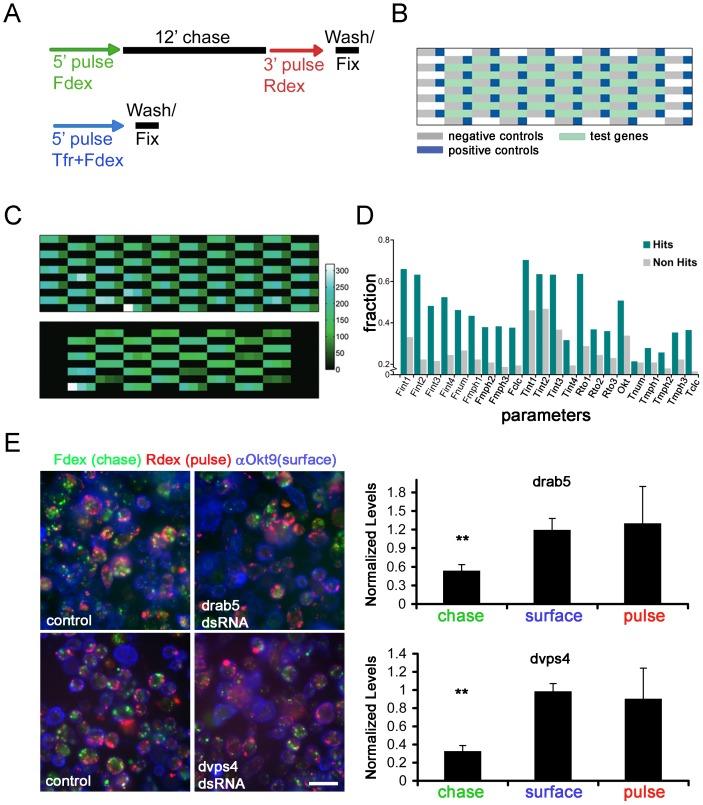
Figure 3. Primary hits validated in a secondary classification assay.
(A–B) Schema (A) and positional patterning (B) on cell arrays of secondary endocytic classification assays carried out for all CG features (upper schema) or a subset of CD features (lower schema).All the test genes were surrounded with local positive controls, and negative controls (see legend in (B)). With this patterning, each gene was tested in triplicate, with three local positive controls and six local negative controls. (C) Heatmap representing raw mean fluorescence intensities (in the pulse channel) across a test cell array used to validate the CG secondary endocytic assay described in (A). Only the means of control wells are shown in the top panel and the inter-control variation in means is representative of a typical experiment. For comparison, the lower panel depicts the mean fluorescence intensities of test genes. (D) The green bars show the fraction of genes predicted as hits for each feature in the primary screen that were also picked up as hits for that feature in the secondary. The gray bars show the fraction of genes not predicted as a hit for each feature in the primary screen that were nevertheless picked up as hits for that feature in the secondary. With a single exception (Tnum) we find that the green bars exceed the gray (p-value 5×10⁻⁶ for 22 fair coin flips) demonstrating the selectivity and reproducibility of our primary assay. (E) Psuedocoloured fluorescence micrographs of representative control and drab5- and dvps4- dsRNA treated populations of cells that were subjected to the CG pulse-chase assay from (A). Both Drab5 and Dvps4 depleted cells were affected in the chase (with Fdex, green) portion of the assay, while the pulse portion (with Rdex, red) was unaffected (see quantitation in bar graphs on the right, normalized to control). Scale bar = 10 µm.

