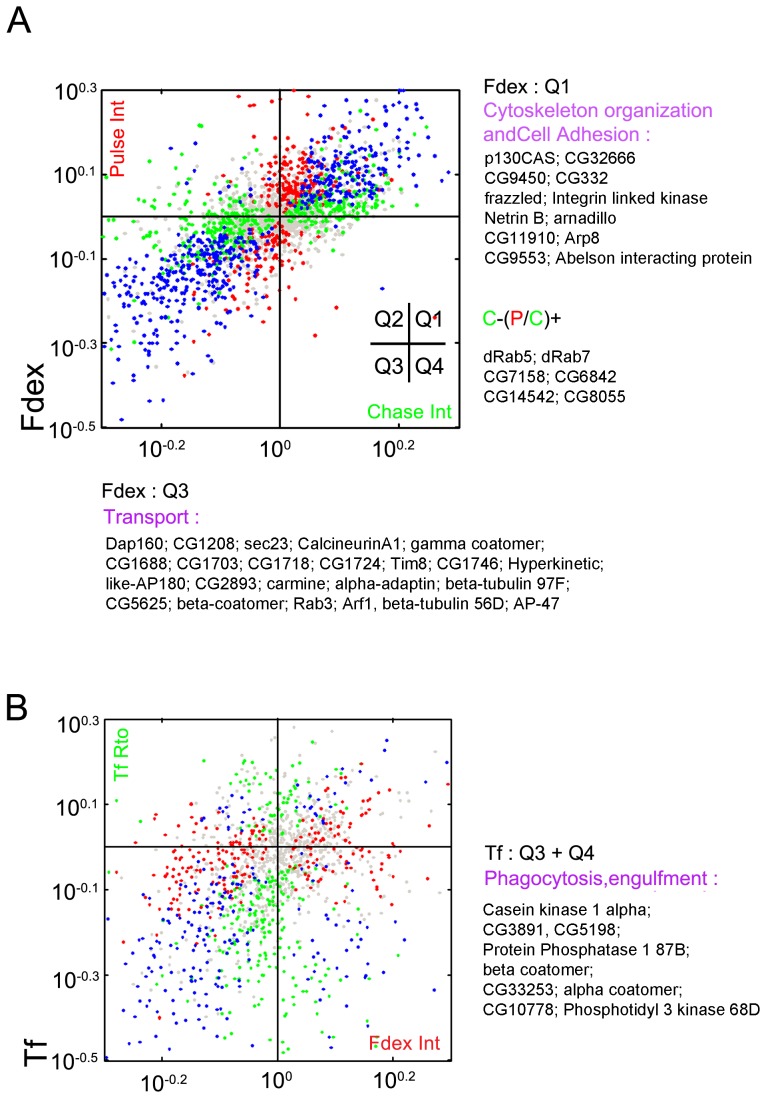
Figure 4. An interpretive summary of classified genes.
(A) Normalized ratios (with respect to local controls) of the fluid-phase pulse intensity vs. chase intensity features for all test genes from the classification assay. See inset axes for quadrant numbering. Quadrant color map:green, genes with only chase features increased or decreased; red, genes with only pulse features increased or decreased; blue, genes with both pulse and chase features increased or decreased; gray, genes that did not significantly perturb these features. A selection of GO categories and genes from quadrants 1 and 3 have been highlighted for the fluid pulse vs chase features; the remaining GO categories and genes populating all quadrants are listed in Table S4. Similar quadrant analyses (not shown) were performed for chase intensity vs. pulse-to-chase ratio (Table S4). Genes involved in lysosomal routing, multivesicular body (MVB) sorting and membrane deformation emerged in quadrant 2 (C−, P/C+). (B) Normalized ratios (with respect to local controls) of the TfR ratio vs fluid intensity features for all test genes from the classification assay. Quadrant color map: red, genes with only fluid features increased or decreased; green, genes with only TfR features increased or decreased; blue, genes with both fluid or TfR features increased or decreased; gray, genes that did not significantly perturb these features. Transport genes collected from quadrants 3 and 4 are highlighted (right), and the rest of the GO categories and genes populating populating all the quadrants are listed in Table S4.

