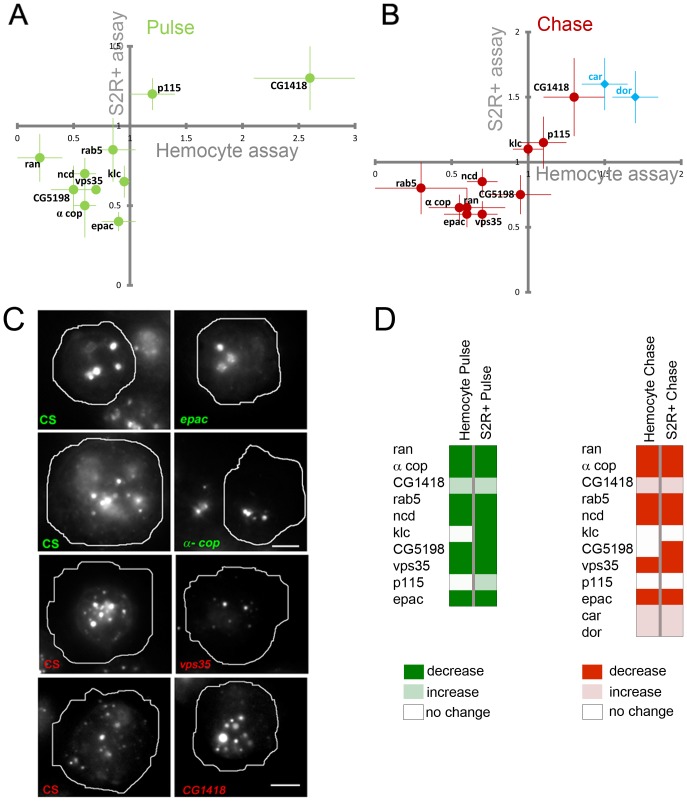
Figure 5. Endocytic phenotypes in mutant primary hemocytes from Drosophila.
(A–D) dsRNA treated S2R+ cells phenocopy corresponding allelic mutants in primary hemocyte cultures in a secondary assay. Scatter plots (A, B) show normalized fold change in fluorescence intensity of dextran that was pulsed (A) or chased (B) in S2R+ cells treated with different dsRNAs (y axis) or in hemocytes (x axis) from the corresponding mutant flies. In all cases, representative values were normalized to those from negative controls (CS hemocytes or zeo dsRNA treated S2R+ cells) and are plotted as mean± SEM. (n>30 for hemocyte assays, n>200 for S2R+ assays in all cases). For the chase assay in (B), we utilized dor4 and car1 mutant hemocytes as positive controls (shown in light blue; Sriram et al., 2003). (C) Representative micrographs of hemocyte cultures from flies carrying hypomorphic alleles of vps35, epac, α-cop and CG1418 assayed as in (B). (D) Summary of the experiment in (A–B) displaying statistically significant (Student's T-test, p<0.05) changes in uptake/retention of mutant hemocytes or gene-depleted S2R+ cells as colour coded maps. Scale bar in (C) = 5 µm.

