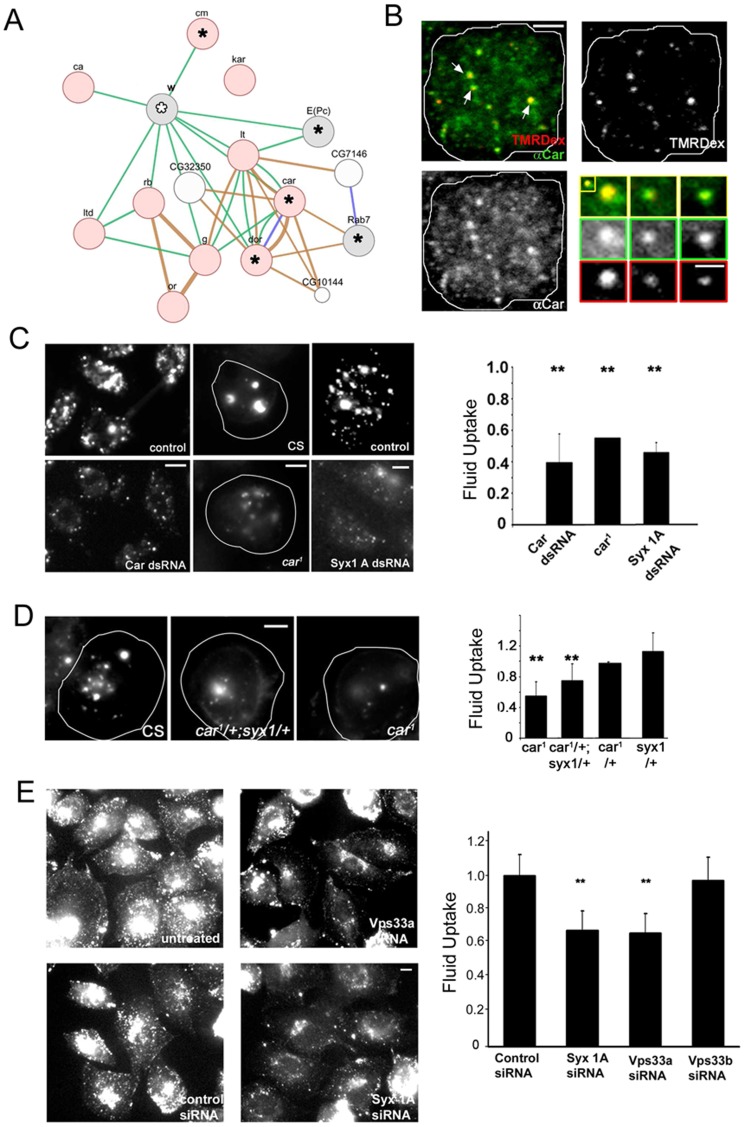
Figure 6. Role of lysosomal genes.
(A) Network map depicting known and predicted interactions (green lines: genetic; blue lines: physical; brown lines: predicted based on conserved data) between the ‘Granule group’ set of eye colour mutants (pink) and selected hits (gray). In this network, genes encoding Carnation (car; the fly homolog of VPS33), Deep orange (dor), Carmine (cm) and Rab7 were identified with roles in CG endocytosis in this study (denoted by black asterisks), while White (w) depletion affected at least one Tf pathway feature (white asterisk). (B) Localization of Carnation on early fluid endosomes. Drosophila S2R+ cells were pulsed with TMR-Dextran for two minutes and fixed and labeled with antibodies to Carnation (αCar). Micrographs show a representative cell imaged in two channels and a pseudo colour merge image (labeled TMRdex and αCar), in red, green and merge respectively). Carnation (green) is seen enriched on peripheral, small, early fluid endosomes (red). Three examples of such endosomes (white arrows in merge panel) are shown in the magnified inset. (C) Fluorescent micrographs depict the levels of fluid uptake in representative S2R+ cells treated with dsRNA against car (first lower panel) or syx1A (last lower panel) or in hemocytes from car1 mutant flies (middle lower panel), with their respective controls (upper panels). Bar graph represents mean and SD of normalized fluorescent integrated intensity per cell from 2–3 experiments, with 100–150 cells per treatment (S2R+ cells) or 40 cells per genotype (hemocytes). (D) Representative fluorescent micrographs depict fluid uptake measured in hemocytes as in (C), in flies that were: homozygous for a mutant allele of car (car1); a hetero-allelic combination of car1/+;syx1/+;or wild type (CS). Also tested were flies heterozygous for syx1/+ and car1/+. Bar graph represents mean and SD of normalized fluorescent integrated intensity per hemocyte from 2–3 experiments with 40 cells per genotype. (E) Representative micrographs show human AGS cells treated with control siRNA or siRNA to hSYX1A and hVPS33A/B and pulsed with FITC-Dextran for 5 min. Right panel - Bar graphs show population averaged mean fluorescence intensity uptake per cell (representative experiment with n>50 cells per replicate, 2 replicates). Scale bar in (B–E) main panel = 5 µm, inset = 1 µm. Double asterisks denote significance p values lower than 0.01 with the Student's T-Test.

