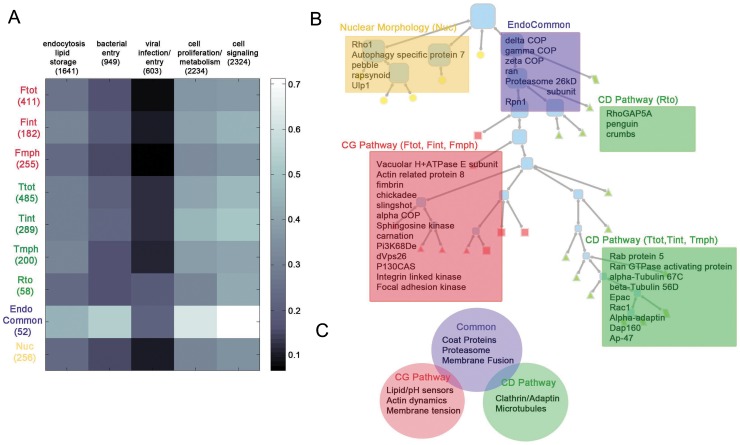
Figure 8. Relationships of hit subsets to Genome wide screens and an interpretive summary of primary hits.
(A) Relationships of hit subsets to other screens. The heat map shows the degree of overlap between hits in different tree categories (rows) with various other RNAi screens (columns). Overlap is quantified as the fraction of genes in a given tree category also identified as a hit by the group of screens. The number of genes in each grouping is denoted in brackets. The screens are grouped as shown in Table S8, first tab. (B) Selected genes from collected nodes (representing the CG pathway (red box), CD pathway (green boxes) and nuclear morphology (light orange box) parameters) are shown overlaid onto the tree hierarchy.

