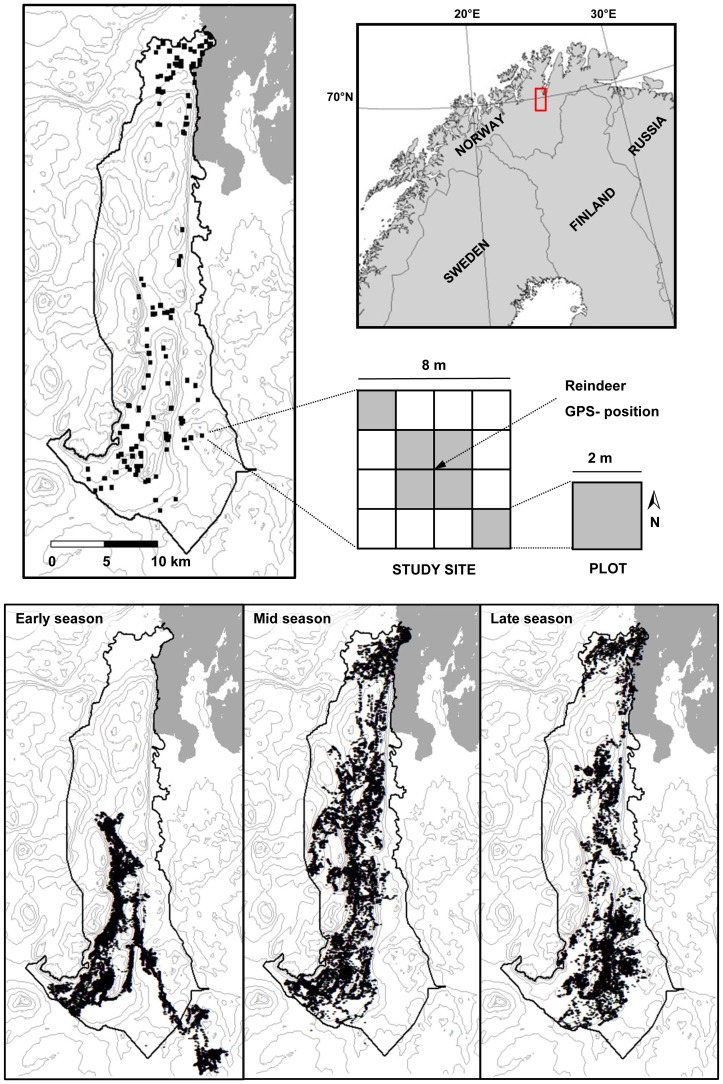
Figure 1. Study location.
Upper panel: The location of the reindeer district in which the study took place along with a presentation of the hierarchical structure of the study design. A total of 144 sites (black squares) were located within the district by GPS-positions from analyses of tracking data from reindeer (see main text for more detail). Within five days of its localisation each site was analysed for the cover and plant phenology of growth forms. Analysis were conducted within six plots (shaded) of the site. Lower panel: The three maps show the positions of freely ranging reindeer in the early, mid and late season of the summer of 2006.

