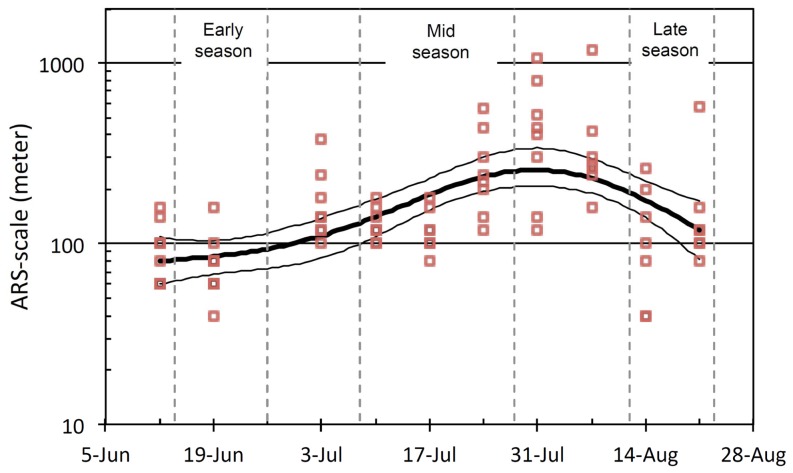
Figure 2. Change in the ARS-scale through the season.
Grey bars are ARS-scales (i.e. the scale of the local maximum in variance of log FPT) for each 7-days period of the movement path of individual reindeer. The thick black line is the predicted ARS-scale from a gamm model using period as a predictor and log ARS-scale as a response. The thin black lines represent standard error.

