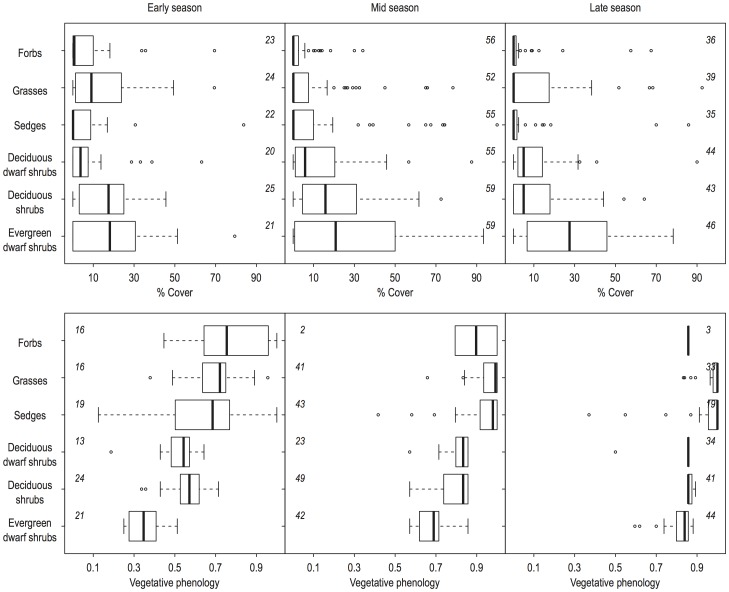
Figure 3. Cover and phenology of growthforms.
Boxplots of a) cover (%) and b) vegetative phenology (presented on a relative scale, see Table 2 for actual scale) of each growth form in early, mid and late season. Numbers within panels represent number of sites for which a) the growth form was present and cover was estimated, or b) where phenological measurements of the growth form was possible.

