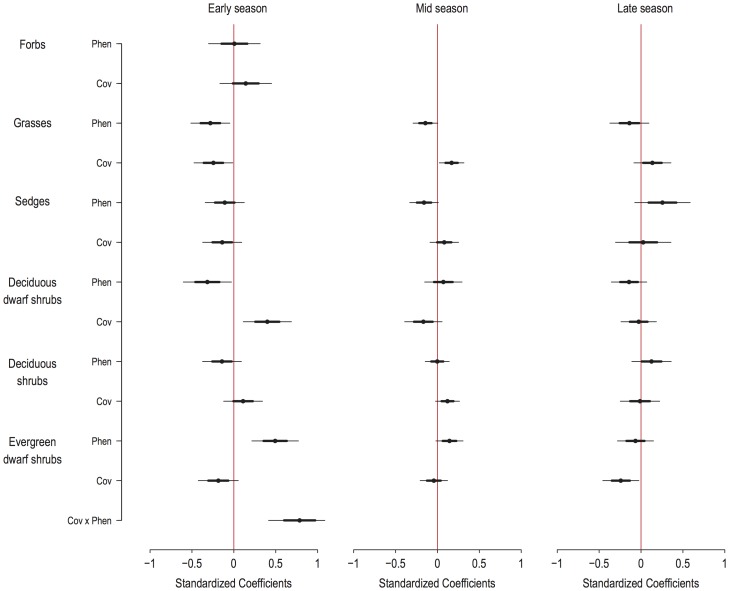
Figure 4. Standardized coefficients of the effects of phenology and cover of growth forms on FPT by reindeer.
Relationships between phenology and cover of growth forms and FPT by reindeer are presented as standardized coefficients (see main text for explanation). Middle point give model estimate, thick lines give ±1 SE (approximately ±68% CI) and thin lines give ±2 SE (approximately ±95% CI). Predictor variables with thin lines that do not cross the central (red) line have a significant relationship to habitat selection by reindeer. Both negative and positive standardized coefficients are related to more selective habitat use by reindeer, with lower or higher values of a predictor variable respectively. For instance, for grasses, younger phenology give higher FPT values, indicating habitat selection for sites where grasses have younger phenology.

