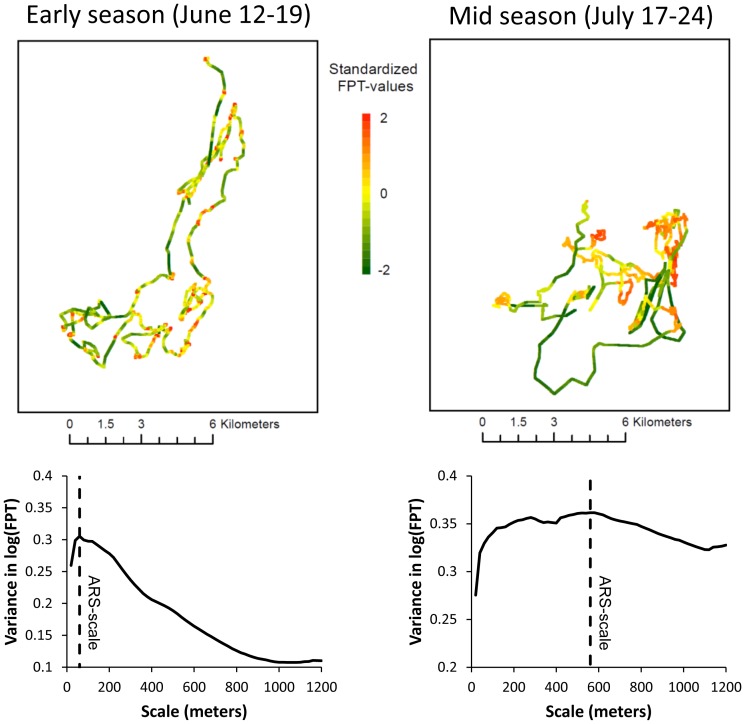
Figure 5. FPT-analyses.
Upper panel: Two 7-days periods (second period of the early season and last period of the late season) of the path of the same individual (reindeer #35). Standardized FPT-values were calculated from the respective ARS-scales and are shown as green to red color along the tracks. Lower panel: Variogram of log-transformed FPT values for the two 7-days periods. The ARS-scale was defined at the local maximum in variance.

