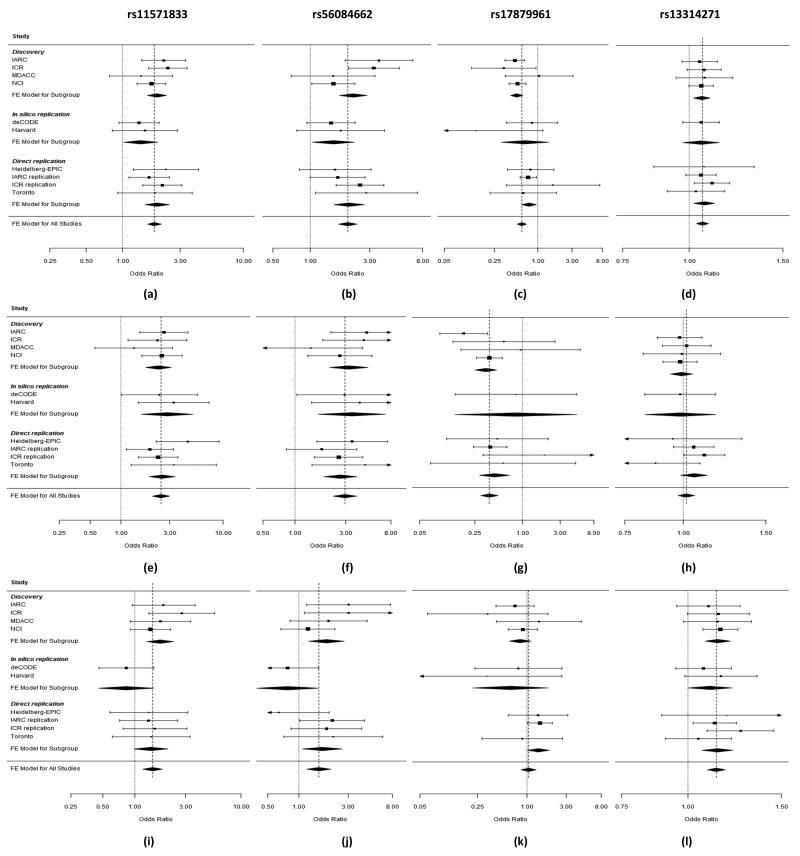
Figure 2. Plot of the odds ratios of lung cancer associated with 13q13.1 (rs11571833 and rs56084662), 22q12.1 (rs17879961) and 3q28 (rs13314271) risk loci (a-l).
All lung cancer based on 21,594 lung cancer cases and 54,156 controls (a-d), SQ based on 6,477 SQ and 53,333 controls (e-h) and AD based on 7,031 AD and 53,189 controls (i-l). Studies are weighted according to the inverse of the variance of the log of the OR calculated by unconditional logistic regression. Horizontal lines: 95% confidence intervals (95% CI). Box: OR point estimate; its area is proportional to the weight of the study. Diamond (and broken line): overall summary estimate, with confidence interval given by its width. Unbroken vertical line: at the null value (OR = 1.0).

