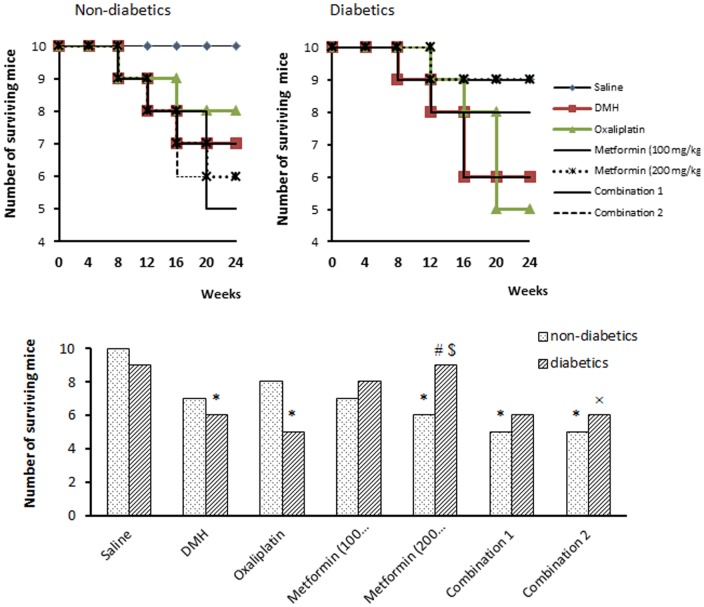
Figure 2. Survival of mice in the experimental groups.
The number of surviving mice in non-diabetic groups (top left panel) and in diabetics groups (top right panel) at different time points overall the course of the experiment. The lower panel demonstrates the final number of the surviving mice at the end of the experiment (end of week 24). Mice [except saline group] were injected with 1,2-dimethylhydrazine (DMH) weekly for 15 week to induce colon cancer then treated with oxaliplatin and/or metformin (100 or 200 mg/kg) for 4 weeks. Data are expressed as absolute number (out of ten) and analyzed using Chi square test at P<0.05. *Significantly different from saline group. #Significantly different from DMH group. $Significantly different from oxaliplatin group. ≠Significantly different from metformin (100 mg/kg) group. ×Significantly different from metformin (200 mg/kg), n = 10 at the beginning of the experiment.

