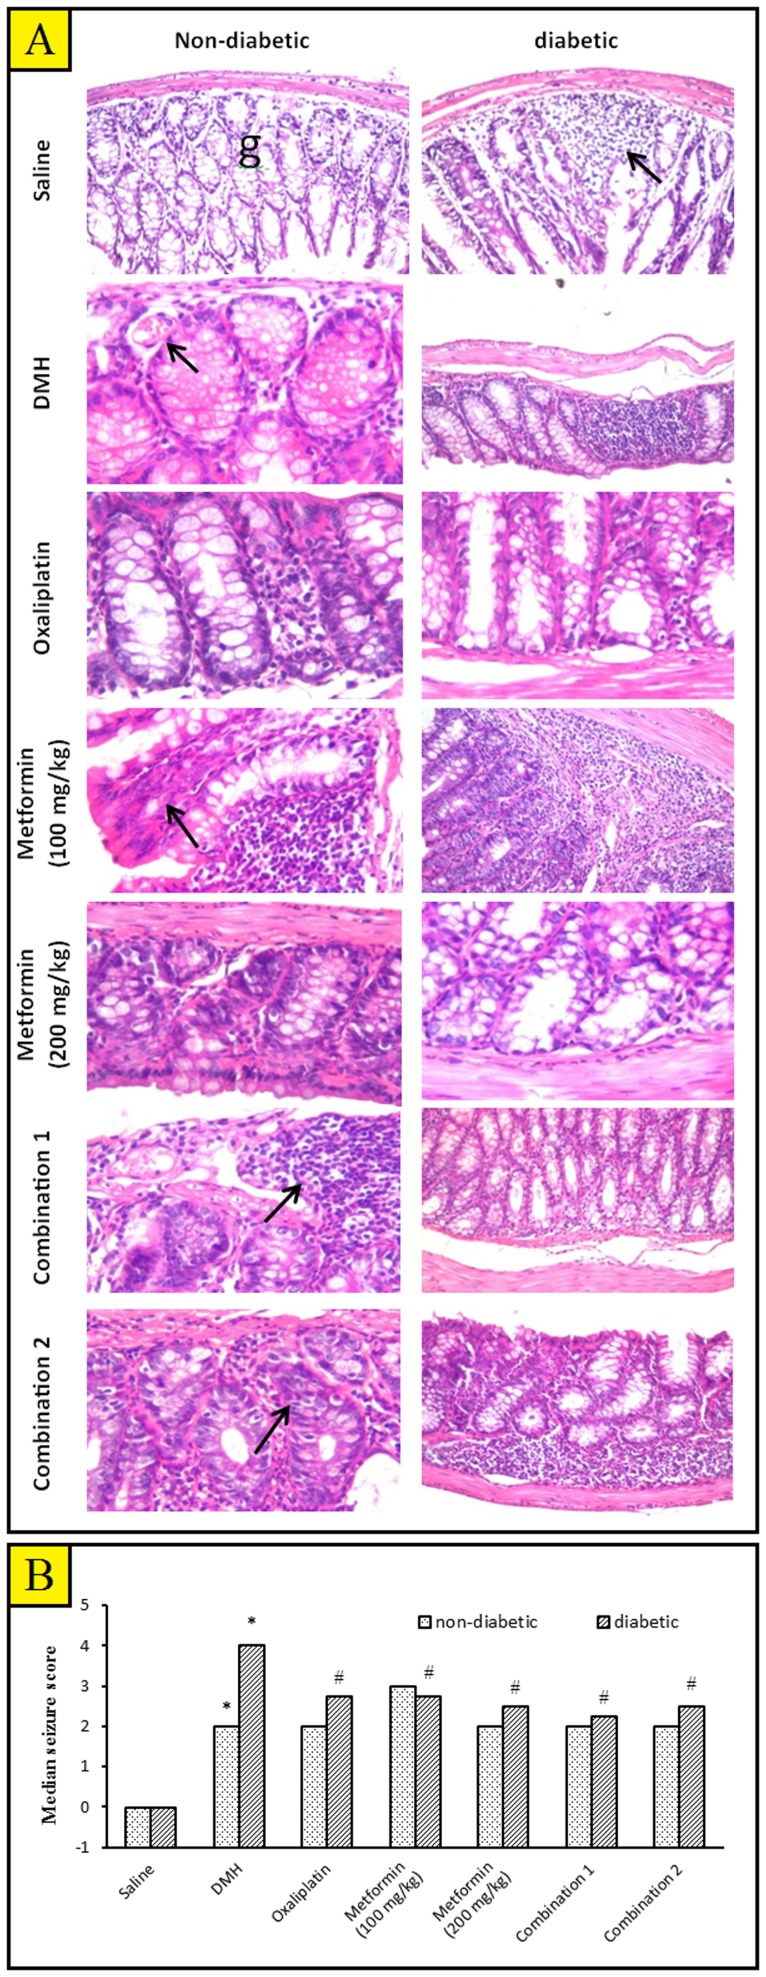
Figure 4. The histopathological picture of colon specimens stained with hematoxylin and eosin (H&E).
A) Photomicrographs from the experimental groups. Colon of non-diabetic/saline mice showing normal histopathological structure of the mucosal layer with glandular structure (g) and underlying submucosa and muscular layer ×40. Colon of diabetic/saline mice showing focal lymphoid aggregation in mucosal layer (arrow) with desquamation of the mucosal epithelium and glandular structure ×40. Colon from non-diabetic/DMH group showing cystic dilatation of the glandular structure with mild dysplastic lining epithelial cells and congestion in blood vessels (arrow) ×80. Colon of diabetic/DMH mice showing focal lymphoid cell proliferation replacing the mucosa ×40. Colon of non-diabetic/DMH mice treated with oxaliplatin showing focal area of disfiguration with inflammatory cells infiltration in mucosal layer ×80. Colon of diabetic/DMH mice treated with oxaliplatin showing inactive lining epithelium with flattened nuclei and a few inflammatory cells infiltration in between ×80. Colon of non-diabetic/DMH mice treated with metformin (100 mg/kg) showing focal lymphoid hypoplasia in the mucosal layer ×80. Colon of diabetic/DMH mice treated with metformin (100 mg/kg) showing massive number of inflammatory cells infiltration in the lumina propria of the mucosal layer with hyperplasia and dysplasia in the lining epithelia of the glandular structure ×40. Colon of non-diabetic/DMH mice treated with metformin (200 mg/kg) showing inflammatory cells infiltration and fibrosis in lamina propria between the glands ×80. Colon of diabetic/DMH mice treated with metformin (200 mg/kg) showing degeneration of the glandular lining epithelium with loss of the nuclei ×80. Colon of non-diabetic/DMH mice treated with a combination of oxaliplatin and metformin (100 mg/kg) showing lymphoid proliferation in mucosal layer ×80. Colon of diabetic/DMH mice treated with a combination of oxaliplatin and metformin (100 mg/kg) showing active glandular structure with lining epithelium of round nuclei ×40. Colon of non-diabetic/DMH mice treated with a combination of oxaliplatin and metformin (200 mg/kg) showing inflammatory cells infiltration in between the glandular structure ×80. Colon of diabetic/DMH mice treated with a combination of oxaliplatin and metformin (200 mg/kg) showing a massive number of lymphoid cell replacing the lamina propria of the mucosal layer ×40. (x 40 = 240.19 µm and x 80 = 238.2 µm. B) A bar chart demonstrating a histopathological score in the colon tissue of non-diabetic and diabetic mice. Mice [except saline groups] were injected with 1,2-dimethylhydrazine (DMH, 20 mg/kg/week) for fifteen weeks to induce colon cancer then, treated with oxaliplatin and/or metformin (100 or 200 mg/kg) for additional four weeks. Results are expressed as median and analyzed using non-parametric Kruskal–Wallis test (non-parametric ANOVA) followed by Dunnett's test for multiple comparisons. *Significantly different from saline group. #Significantly different from DMH group. $Significantly different from oxaliplatin group. ≠Significantly different from metformin (100 mg/kg) group. ×Significantly different from metformin (200 mg/kg) group, n = 5–6.

