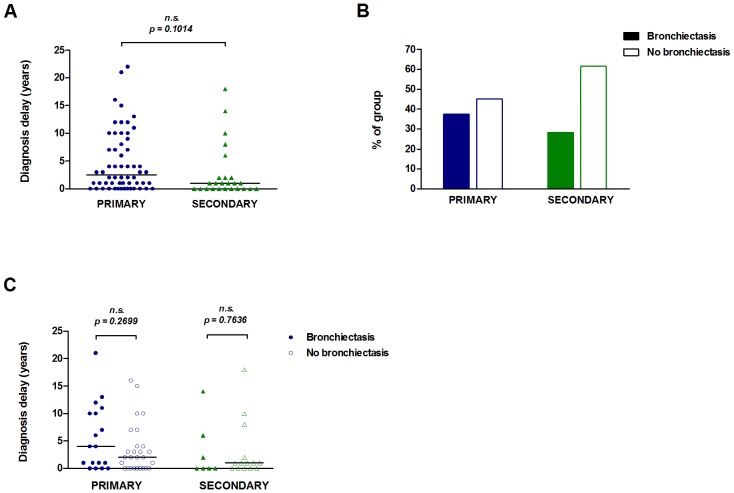
Figure 1. Diagnostic delay and the presence of bronchiectasis.
Diagnostic delay (time between symptom onset and antibody deficiency diagnosis) was determined for the primary (n = 58) and secondary (n = 25) groups (A). The percentage of subjects with or without bronchiectasis (determined by high-resolution CT scan) is shown for each group (B). Diagnostic delay by bronchiectasis presence or absence is shown for the primary (n = 45) and secondary (n = 21) groups (C). The bars in panels A and C represent median values. Data in panel A were analysed by a two-tailed unequal variance t-test and data in panel C were analysed by a two-tailed Mann-Whitney test; n.s. non-significant (p values <0.05 were considered significant).

