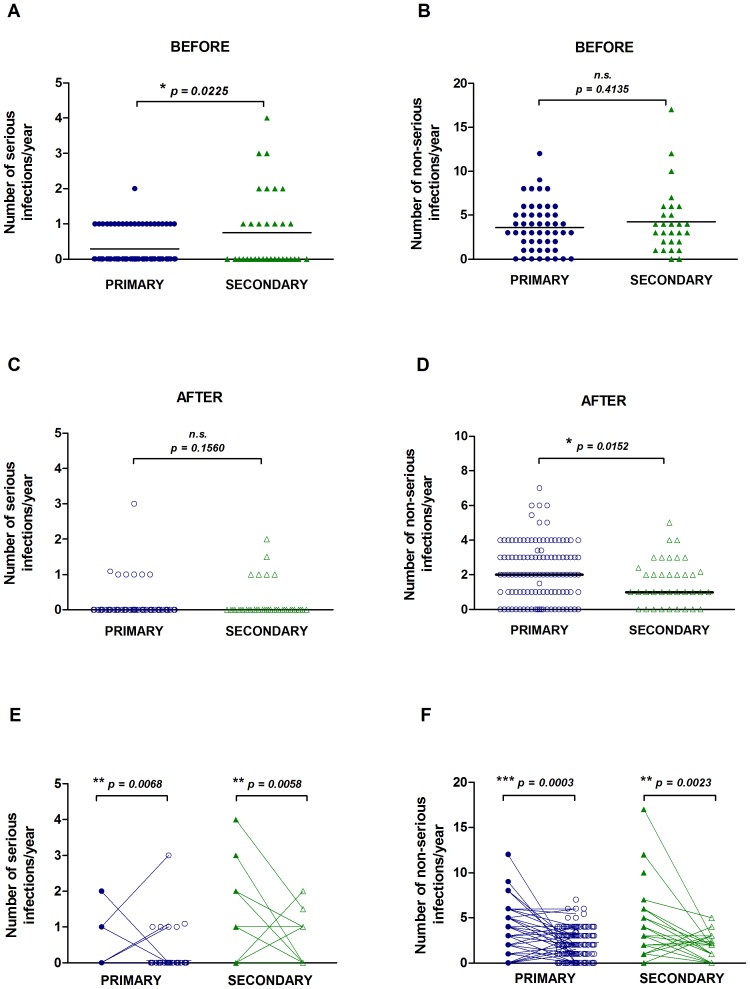
Figure 3. Number of serious and non-serious infections before and after Ig-replacement treatment.
The number of serious infections requiring hospitalisation or IV antibiotics and the number of patient-reported non-serious infections in the year preceding Ig-replacement treatment (A–B) and in the year 2012/2013 (C–D) is shown. The bars represent the group medians. Serious (E) and non-serious infections (F) are shown for each patient before (filled symbols) and after (open symbols) treatment. Data in panels A–D were analysed by a two-tailed unequal variance t-test and data in panels E–F were analysed by a two-tailed paired t-test; * p<0.05, ** p<0.01, *** p<0.001; n.s. non-significant.

