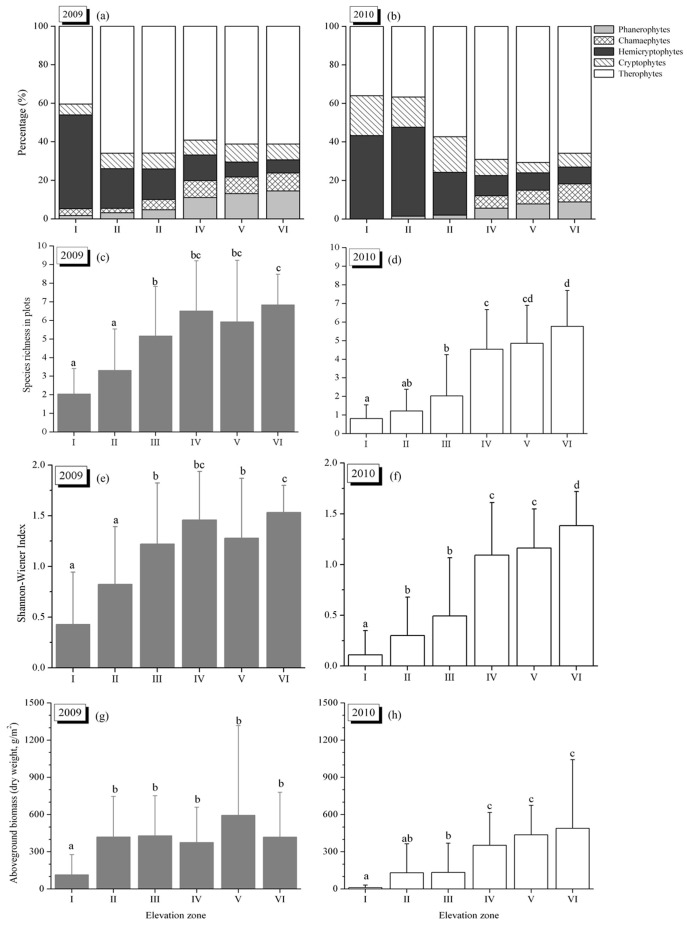
Figure 3. Life form percentage, species richness in plot (mean±SD), Shannon-Wiener Index (mean±SD) and above-ground biomass (mean±SD) of vegetation communities across the elevation zones in 2009 and 2010.
Life form percentage was calculated by total recorded plant species date in each elevation zone. Different letters (a, b, c) above the boxes indicate significant differences for P<0.05.

