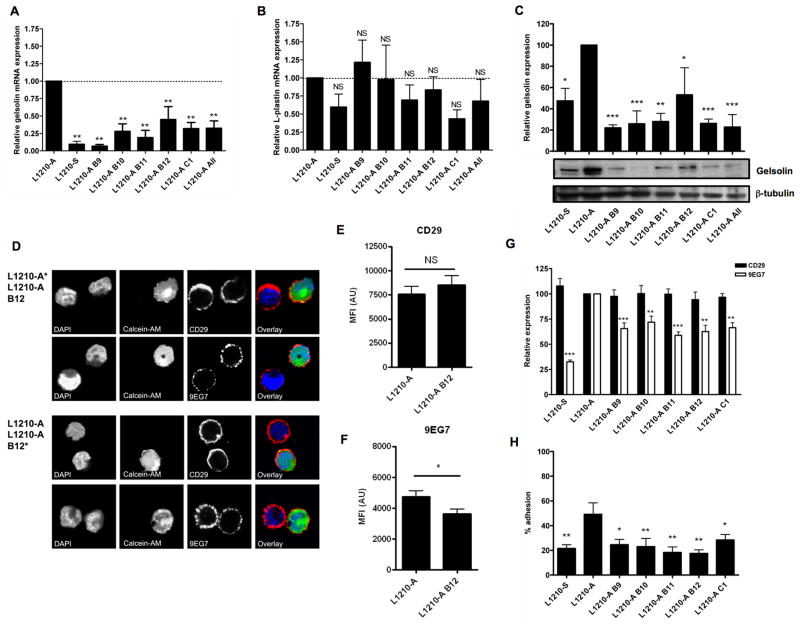
Figure 4. Gelsolin knock down decreases cell adhesion.
Relative mRNA expression of (A) gelsolin and (B) L-plastin in L1210-S, L1210-A and L1210-A geslolin shRNA knock-down cells. (C) Gelsolin protein expression in L1210-S, L1210-A and L1210-A geslolin shRNA knockdown cells were analyzed by westernblot analysis with anti-gelsolin and anti-β-tubulin as loading control. The western blots shown are representative for five experiments. Mean values are represented ± SEM (n=5). One-way ANOVA with Dunnett’s multiple comparison test was used to perform statistical analysis (* = P<0.05, ** = P<0.01, *** = P<0.001). (D) L1210-A or L1210-A B12 gelsolin shRNA knock-down cells were stained with Calcein-AM and mixed with unstained L1210-A or L1210-A B12 gelsolin shRNA knock-down cells, respectively. The mixed cell populations were stained with CD29 or 9EG7 and DAPI as nuclear stain and imaged by confocal microscopy. Fluorescence intensity quantification of (E) CD29 expression (n=25) and (F) binding of 9EG7 (n=19) on L1210-A or L1210-A B12 gelsolin shRNA knock-down cells. (G) Expression of CD29 and binding of 9EG7 on L1210-S, L1210-A and L1210-A gelsolin shRNA knock-down cells were analyzed by flow cytometry.

