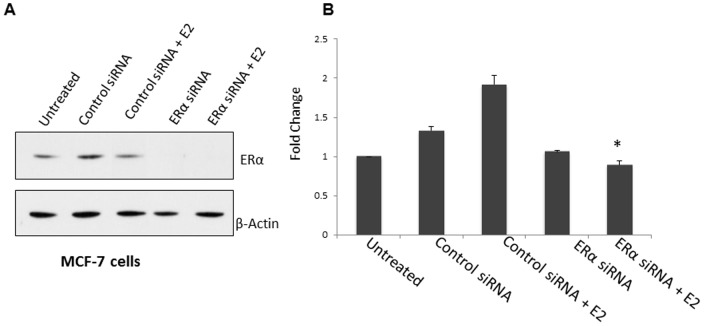
Figure 6. Knockdown of ERα results in decrease in Mcl-1 mRNA expression.
(A) Western blot analysis confirms ERα silencing in MCF-7 cells after siRNA transfection. Blot was reprobed with anti-β-actin as a loading control. (B) Real-time PCR analysis of Mcl-1 transcript levels in MCF-7 cells was performed. Cells were serum starved for 5 days prior to transfection. After transfection, cells were stimulated with estrogen (E2, 10 nM) for 24-hours. For qPCR, 100 ng template RNA was amplified using primers specific to Mcl-1. qPCR results were standardized using primers for housekeeping gene cyclophilin. Results are expressed as fold change relative to changes in basal levels observed in untreated sample. Data represents the mean of three independent experiments ± standard error. (* indicates p≤0.001 compared to untreated control cells).

