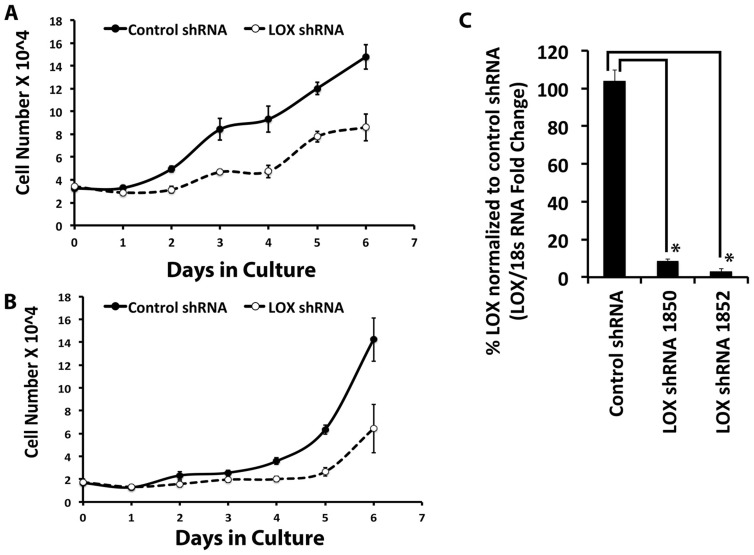
Figure 7. Lysyl oxidase (LOX) regulates C3H10T1/2 cell growth.
C3H10T1/2 cells were transduced with lentiviral particles containing LOX shRNA1850, LOX shRNA 1852, or control shRNA. Non-transduced cells were eliminated using puromycin, a selective reagent. Transduced cells were seeded at 20,000 cells per well in 12-well plates for the growth curve analysis. Total RNA was also collected from these cells to measure lysyl oxidase mRNA levels by real-time PCR. A) The growth curves were plotted for cells transduced with either LOX shRNA 1852 or control shRNA. Data are presented as means ± SD (n = 4). B) The growth curves were plotted for cells transduced with either LOX shRNA 1850 or control shRNA. Data are presented as means ± SD (n = 4). C) The chart shows lysyl oxidase mRNA levels in LOX knockdown and control cells. Two independent LOX shRNA with different shRNA sequences were used in this experiment. Data are presented as means ± SD (n = 3*, p<0.05; Student's t-test).

