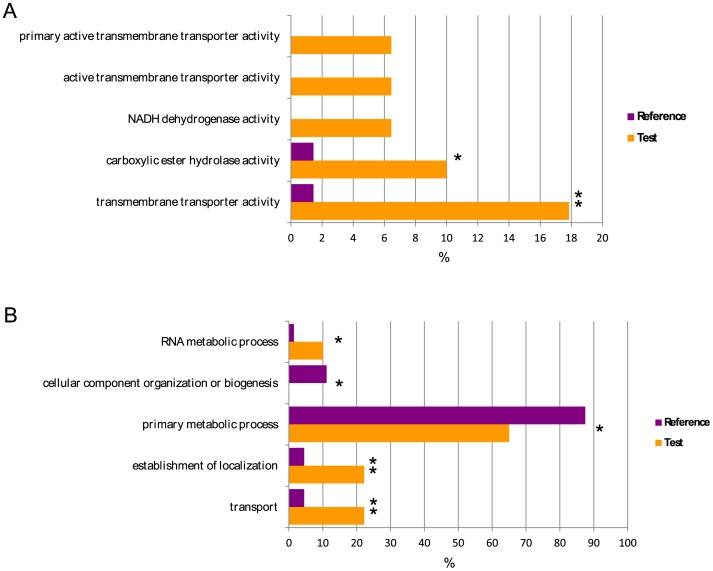
Figure 6. Relative abundance of selected GO terms in the transcriptome of fungal isolate F1.
GO terms corresponding to molecular functions (A) and cellular processes (B) are shown for F1 confronted with PS (reference, purple bars), and for the subset of genes not detected in the transcriptome of F1 grown isolated (test, orange bars). Asterisks indicate statistically significant differences for p-value<0.05 (**) and p-value<0.1 (*).

