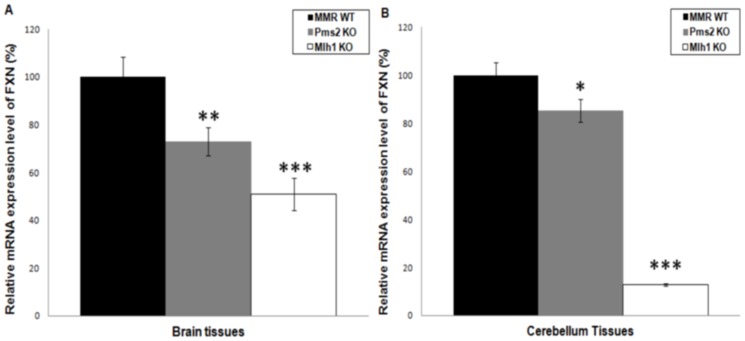
Figure 4. Effect of MutLα components on somatic FXN transcription in vivo.
Relative RT-qPCR analyses of somatic FXN transcription level based on the MMR genotype (WT, Pms2 KO or Mlh1 KO) in (A) FXN GAA/MMR brain tissues (n = 2–4), and (B) FXN GAA/MMR cerebellum tissues (n = 2–4). Statistical analysis of the experiment was perform using the student's t test. Error bars = S.E.M, * = p<0.05, ** = p<0.01, *** = p<0.001.

