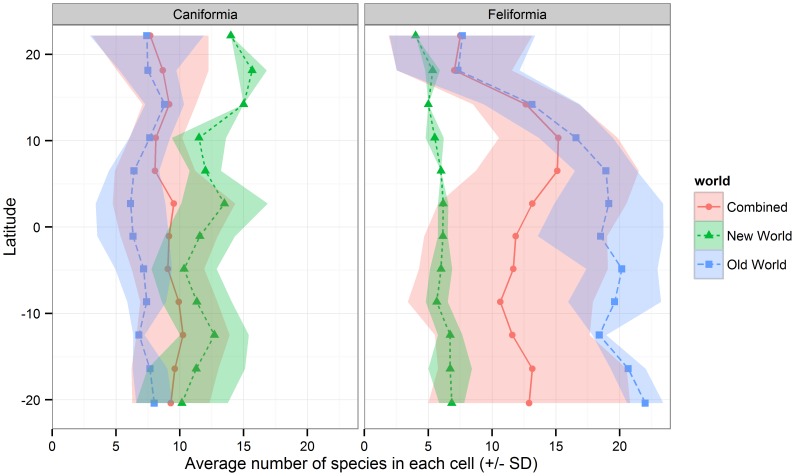
Figure 3. Latitudinal Carnivora species richness distribution.
The average number of species for both Feliformia and Caniformia was calculated on each latitudinal height, in 5 degree grid-cells, for both the New World, the Old World and combined. Islands and areas with lower than 50% land was excluded.

