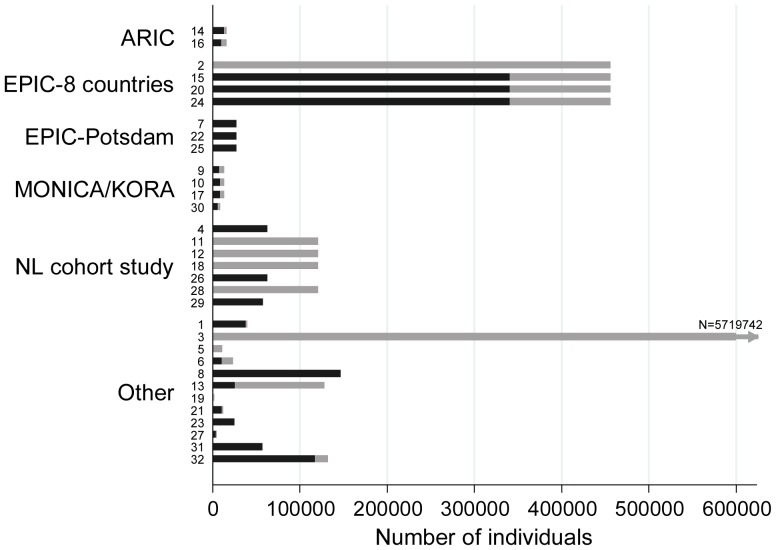
Figure 2. Number of individuals in original cohort on which case-cohort study is based, before and after exclusions.
Total length of bar represents number before exclusions, length of black bar represent number after exclusions. Where the bar is all black, the size of the original cohort after exclusions was not reported. Where the bar is all grey, there were no exclusions from the original cohort. Bars are labelled according to the number of the paper in the reference list in Appendix S2.

