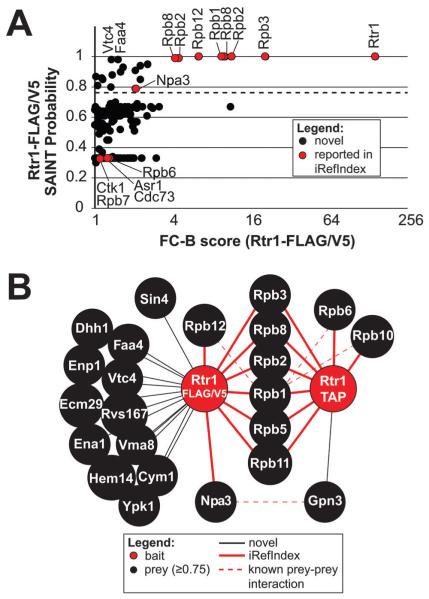
Fig. 1.
Identification of the Rtr1 interactome by AP-MS followed by SAINT. (A) Overview of the interactions identified by SAINT in single-affinity Rtr1 purifications. The graph compares the FC-B score against the SAINT probability scores. The dashed line represents the 0.75 probability cutoff. Proteins of interest are indicated with a label. All identifiers for these data are included in Table S2 (ESI†). (B) A high confidence Rtr1 interaction network is shown illustrating the unique and shared interactions identified in single or double-affinity purifications with a SAINT probability score of ≥0.75. A legend describing all nodes and edges is shown below the network. Previously identified Rtr1 interactions as described in iRef Index are identified with red edges whereas novel interactions are identified with black edges.

