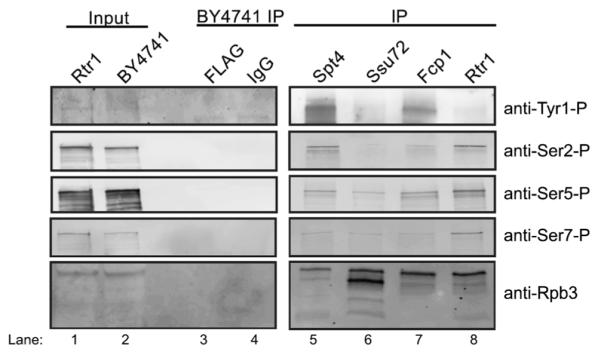
Fig. 5.

Western blot analysis of CTD phosphatase affinity purifications for identification of the patterns of CTD phosphorylation. The panels to the left show representative input samples for Rtr1-FLAG and BY4741. Control IPs were also performed with both IgG Sepharose and FLAG agarose resin (BY4741 IP). The bait proteins used for affinity purification are indicated at the top of the figure and the antibody used for western blotting is labelled to the right. Spt4-TAP was isolated with IgG sepharose whereas all CTD phosphatases were affinity captured on anti-FLAG agarose. Anti-Rpb3 western blots are included as a loading control for RNAPII levels in each IP. Lane numbers are also given at the bottom of the figure.
