
Figure 1.
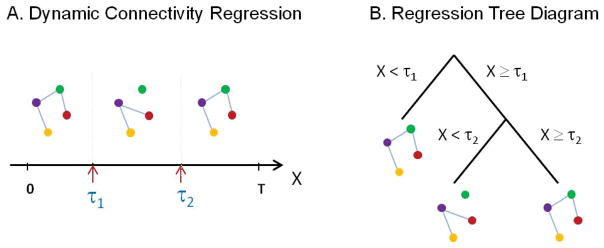
A toy example. (A) Two change points (denoted τ1 and τ2) exist where the functional connectivity between the 4 ROIs changes behavior. DCR allows us to not only detect the change points, but also estimates an undirected graph which measures the functional connectivity between the ROIs. Equivalently, the temporal partitions can be expressed as a regression tree (B) with a graph estimated at each terminal node.