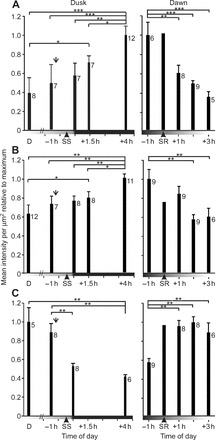
Fig. 7.

RhOps1-2, RhGqα and RhArr levels change with different time courses during dawn and dusk. The dusk and dawn series were assayed separately. Each contains data pooled from three separate confocal sessions; each confocal session included immunostained sections of LEs from two to four animals fixed at each of the different time points. Sections were imaged as described in the Materials and methods and in the legend to Fig. 2. Data are plotted as described in the legend to Fig. 4. On the abscissa, time is expressed as hours before or after sunset (SS) or sunrise (SR). The bar provides a rough indication of the change in light intensity during dusk and dawn. The dusk series includes a midday (D) time point. The downward arrows indicate the estimated time when circadian clock input to LEs begins (Fig. 5). The number of animals assayed at each time point is indicated next to each bar. Asterisks indicate significant differences (one-way ANOVA followed by the Student–Newman–Keuls test; ***P<0.001, **P<0.01, *P<0.05). The dawn series includes SR data from Fig. 4. (A) RhOps1-2. (B) RhGqα. (C) RhArr.
