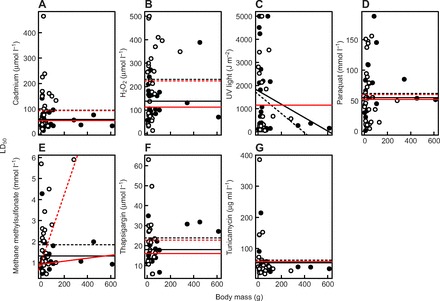
Fig. 1.

The association between body mass and mean LD50 (the dose that killed 50% of cells) for each species in tropical (○) and temperate (●) birds. The lines show the outcome of a least square regression, where the dashed line represents the regression for tropical birds and the solid line the regression for temperate birds. We show fitted lines for the basic non-phylogenetic model in black and those for a model including Pagel's evolutionary hypothesis in red.
