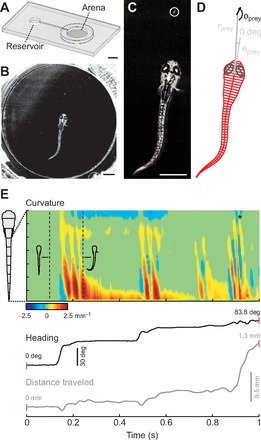
Fig. 1.

Collection and analysis of prey capture videos. (A) Diagram of the custom-built testing chamber used for collecting high-speed videos of prey capture behavior. Scale bar, 5 mm. (B) Image of zebrafish larva in the central arena performing prey capture behavior. Scale bar, 1 mm. (C) Enlarged image of the larva from B (note the paramecium in the circle). Scale bar, 1 mm. (D) Information extracted from the image in C following tracking analyses. Red lines indicate the automated processing of axial kinematics whereas black and gray lines indicate the manual measurements of eye and paramecium orientations. The long axes of the eyes are marked by a line bisecting them. Using these data, we could determine the proximity of the paramecium (rprey), its azimuth (θprey) and its direction of travel (ϕprey) relative to the fish's body (0 deg reference). (E) A representative trial from a different fish illustrating the curvature of the tail (top panel), the heading of the fish relative to its original heading before detecting the paramecium (middle panel) and the distance traveled (bottom panel) during the entire prey capture sequence. All measurements are presented on the same time scale. In the heat map of curvature, red represents positive values to the left, while blue represents negative values to the right. Outlines of body shape from time points indicated by the dashed lines are included to illustrate this point. The asterisk indicates the point of capture in this sequence.
