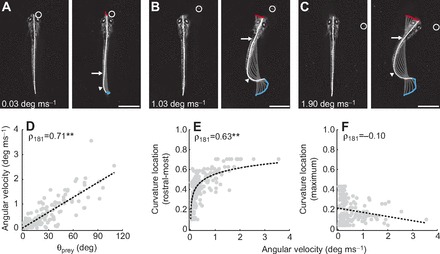
Fig. 2.

Speed and shape of the initial turn following prey detection. (A–C) Frames from high-speed videos illustrating differences in the speed of turns related to prey location. Paramecium location varies in azimuth, from small to large angles (A–C) from the mid-sagittal plane. The speed of turns is indicated in the respective panels. The locations of the most rostral and maximum curvatures are indicated with arrows and arrowheads, respectively. Frames on the left are a single snapshot of the larva just prior to movement, while those on the right are the point of maximum curvature during the turn. In this and subsequent figures, gray lines represent the midline of the fish and are presented at 4 ms intervals to demonstrate the change in curvature during this period. Movement of the mouth (red) and the tip of the tail (blue) is also shown. A circle indicates paramecium location. All scale bars, 1 mm. (D) The maximum angular velocity generated during the initial turn scales with the absolute value of the azimuth of the paramecium (θprey, N=183 bends during 50 capture trials in 17 larvae). Trend line is a linear fit. (E) The most rostral location at which bending was observed above 0.4 mm−1 plotted against the magnitude of the angular velocity of turns. Axial bending occurs more rostral with increased angular velocity. Body length is normalized from 0 (tip of the tail) to 1 (tip of the head). We can track this relationship up to the level of the swim bladder (~0.7), beyond which curvature values were set to 0 mm−1 (see Materials and methods). Trend line is a linear fit to the natural log of curvature location versus angular velocity. (F) The location of maximum tail curvature does not vary systematically with angular velocity. Body length is normalized from 0 (tip of the tail) to 1 (tip of the head). Trend line is a linear fit. **P<0.001 following Spearman's rank test (ρ).
