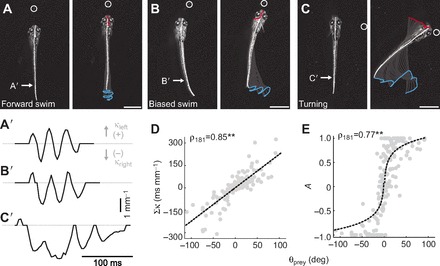
Fig. 4.

Biasing of movements following the initial turn. (A–C) Frames from high-speed videos illustrating differences in the directionality of movements following the initial orientation turn. These range from forward swimming (A), to biased swimming (B), to unilateral turning (C). Frames on the left are a single snapshot of the larva just prior to movement, while those on the right are at the completion of the movement. Other conventions are as indicated in Fig. 2A–C. All scale bars, 1 mm. In A′–C′, raw curvature data from the regions indicated by the arrows in A–C provide a means to quantify the relative symmetry of leftward curvature (positive κ values) and rightward curvature (negative κ values) with respect to paramecium location. As paramecium location progressively moves to the right, so too does the weight of curvature to the right side, from symmetrical swimming (A′) to biased swimming (B′) to turning (C′). Dashed gray line indicates zero curvature. (D) Integrated curvature (Σκ) varies systematically with the azimuth of the prey (N=183 bouts). Trend line is a linear fit. (E) A normalized measure of tail movement asymmetry (A, Eqn 3) also varies with paramecium location. A tail movement asymmetry value of 0 represents symmetrical displacement whereas asymmetries of 1 or −1 represent exclusively leftward or rightward displacement, respectively (see Materials and methods). There is saturation of this relationship as asymmetries approach completely leftward or rightward displacements (N=183 bouts). Trend line is a linear fit to the natural log of movement asymmetry versus prey azimuth. **P<0.001 following Spearman's rank test (ρ).
