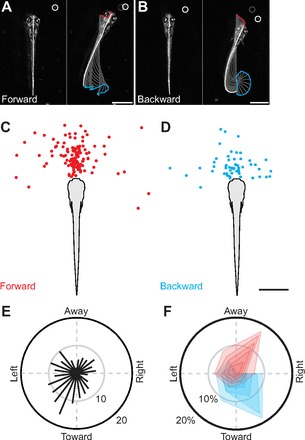
Fig. 5.

Forward versus backward movement during prey capture. (A,B) Frames from high-speed videos illustrating differences in the direction of larval movement, which appear unrelated to prey location. Based on positive versus negative values in longitudinal velocity, movements are described as forward (A) or backward (B). Frames on the left are a single snapshot of the larva just prior to movement, while those on the right track movements up to a fixed time interval (132 ms). Other conventions are as indicated in Fig. 2A–C. All scale bars, 1 mm. (C,D) Location of the paramecium immediately before forward (N=128 bouts, C) or backward (N=55 bouts, D) movements of the larvae. The distributions of paramecia are largely overlapping. Scale bar, 1 mm. (E) Histogram plotted on a polar axis indicating the direction of movement of the paramecia for all trials, relative to the fish. Bar length indicates the number of samples per 15 deg bin (N=183). (F) Polar plot indicating the direction of paramecium movement related to whether the larva moved forward (red) or backward (blue). Contours represent the percentage of the total number of trials per 60 deg bin. From the center outward, each contour represents 10% increments. The first contour is the 90–100th percentile of larval velocity, the second is the 80–100th percentile, and so on to the 50–100th percentile in both the forward (N=128) and backward (N=55) directions. Statistics for the fastest 10–50% of responses using Mann–Whitney U-tests are as follows: 10%: U=11, Z=2.45, P<0.05, N=19; 20%: U=53, Z=2.99, P<0.01, N=37; 30%: U=130, Z=3.52, P<0.001, N=55; 40%: U=258, Z=3.64, P<0.001, N=73; and 50%: U=446, Z=3.81, P<0.001, N=92. Larvae back up when paramecia are moving toward them, but advance when paramecia are moving away.
