
Fig. 6.
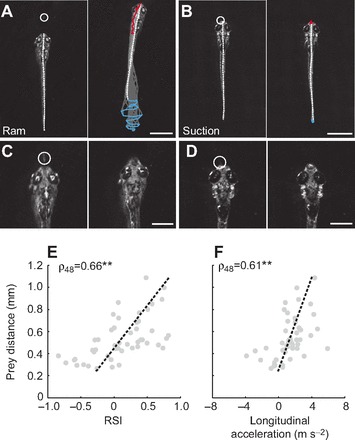
Different capture strategies based on distance. (A,B) Frames from high-speed videos illustrating the performance of ram-type (A) and suction-type (B) capture maneuvers. Frames on the left are a single snapshot of the larva just prior to movement, while those on the right are at the completion of the movement. Other conventions are as indicated in Fig. 2A–C. Scale bars, 1 mm. (C,D) Higher magnification frames from the same capture sequences as in A and B, illustrating dorsal head flexion during ingestion. Frames on the left are 8 ms before the larvae ingest the paramecia, while frames on the right are at the point of ingestion. A circle indicates paramecium location. Scale bars, 0.5 mm. (E) Distance of the larva from the paramecium versus the ram–suction index (RSI) score at the initiation of capture movements demonstrates a gradation in capture response (−1=suction, 1=ram). At short distances, the movements tend to be more suction-like and as distance increases, the movements become more ram-like (N=50). Trend line is a linear fit. (F) Distance of the larva from the paramecium versus the maximum longitudinal acceleration of the final capture swim also demonstrates a gradation in response. As the distance from the paramecium increases, the maximum longitudinal acceleration also increases. At the shortest distances, negative accelerations are observed, indicating backward movements (N=50). Trend line is a linear fit. **P<0.001 following Spearman's rank test (ρ).