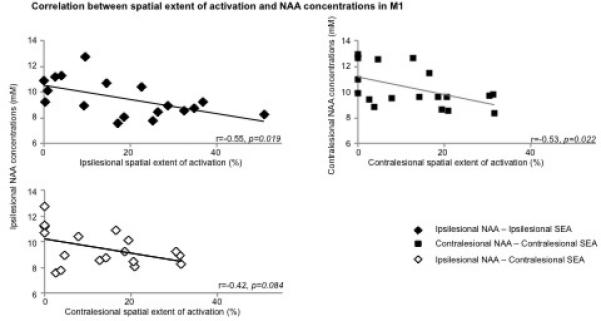
Fig. 2.

Scatterplot of Spearman correlations between (A) ipsilesional NAA concentrations (mM) and ipsilesional (top row, black diamond, r=−0.55, p=0.02) and contralesional (low row, white diamond, r=−0.42, p=0.08) handgrip-related spatial extent of activation (SEA, %), and between (B) NAA and SEA within contralesional M1 (square, r=−0.53, p=0.02) in stroke patients.
